My Usage
The My Usage page shows the current user where they stand against the spend limits applied to them. It aggregates the global user limit, any group-level limits, and any per-project limits the user is subject to.
Role access: User (always). Super Admin and Project Manager see this page when they switch to personal view via the profile menu. Admin and Auditor are locked to management view and do not see this page.
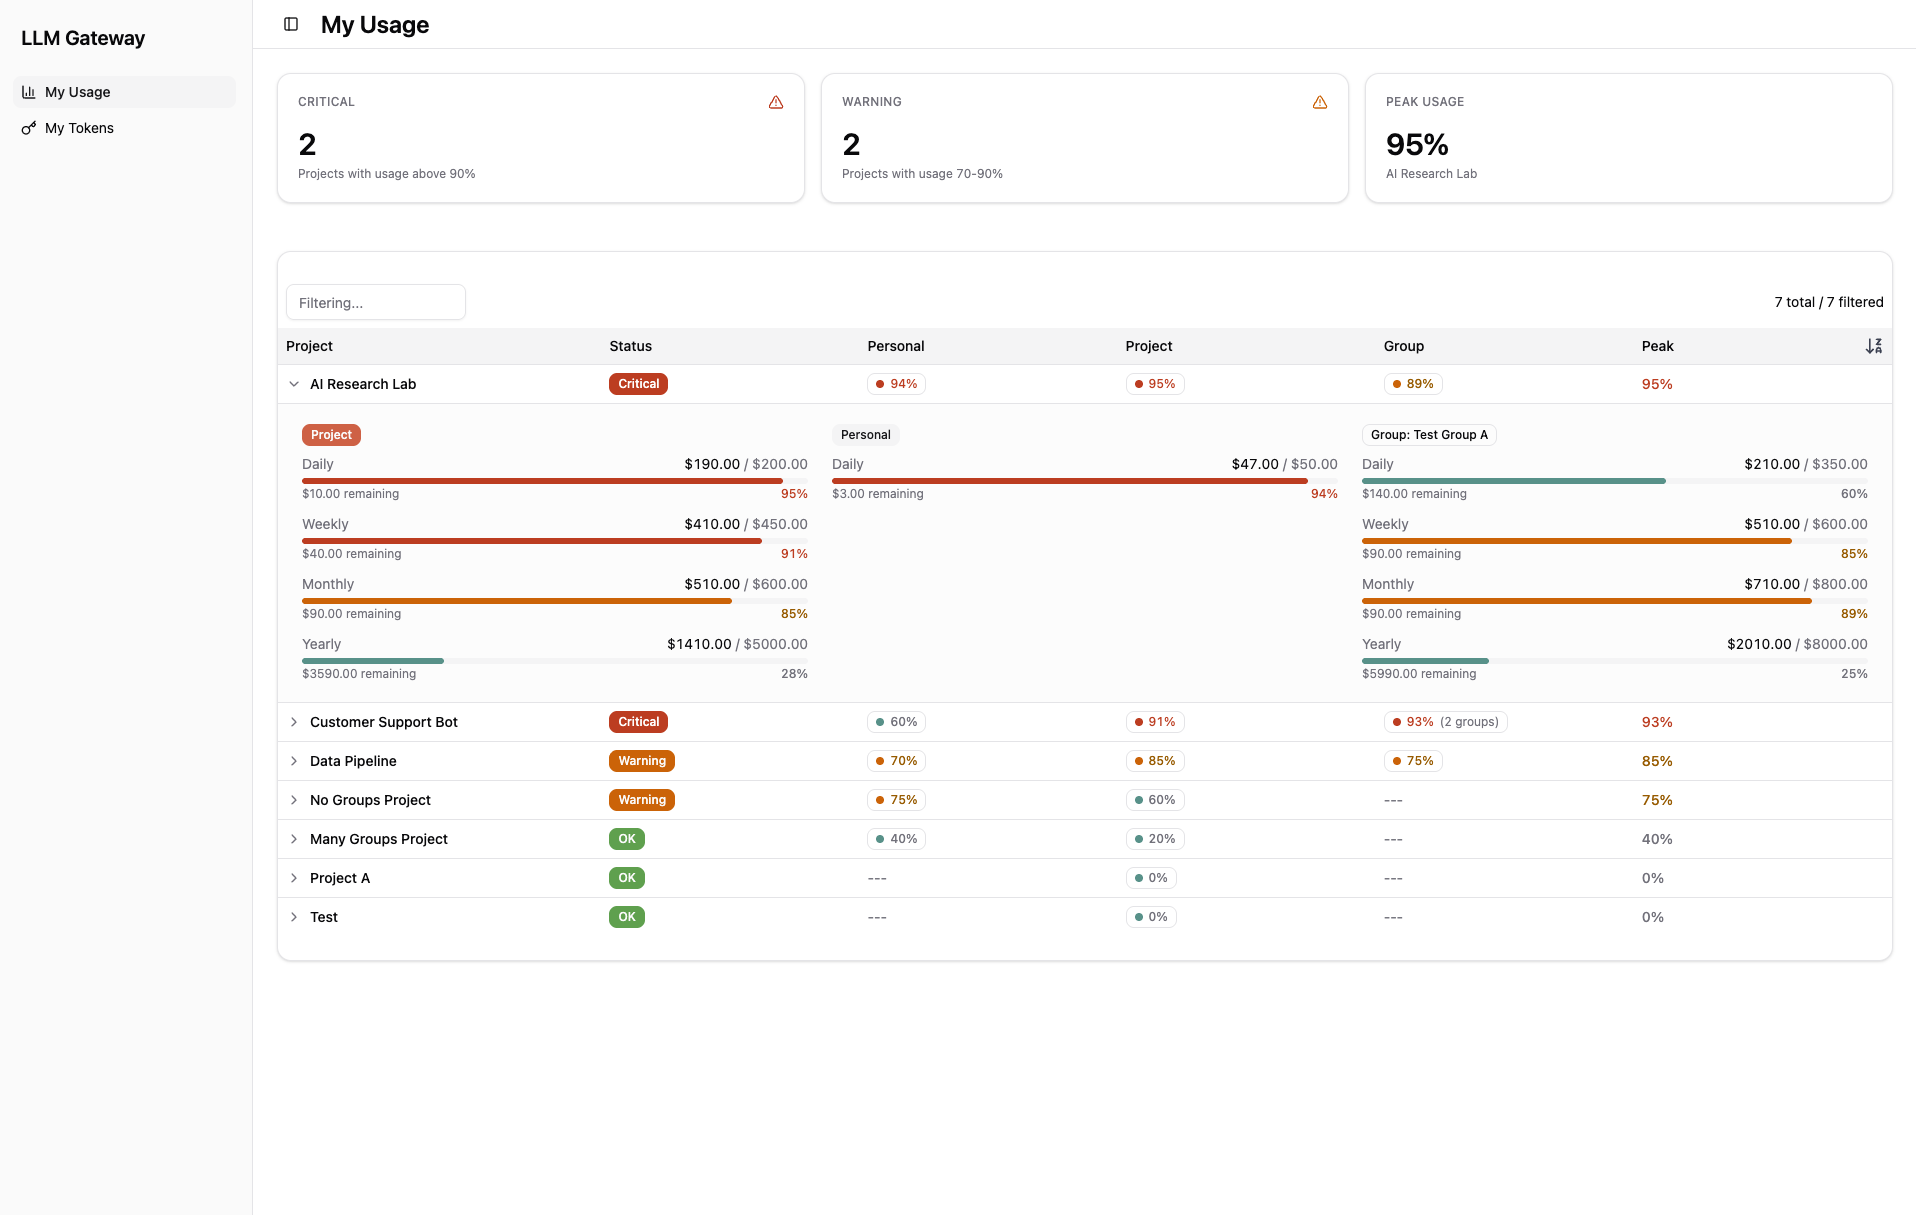
Summary Tiles
Three tiles at the top of the page summarize the user's limit utilization across all projects:
-
Critical - Number of projects where peak utilization is at or above 90%,
-
Warning - Number of projects where peak utilization is between 70% and 90%,
-
Peak Usage - The single project with the highest peak utilization, shown as a percentage with the project name.
Project Table
A table below the summary tiles lists one row per project the user has activity in. Each row shows:
-
Project - Project name,
-
Status - Badge showing Critical, Warning, or OK based on the highest-utilization limit applied to this project,
-
Personal - Peak utilization of the user's personal (user-level) limit for this project, shown as a colored percentage pill,
-
Project - Peak utilization of the project-level limit, shown as a colored percentage pill,
-
Group - Peak utilization of any group-level limit (with a count when multiple groups apply),
-
Peak - The overall highest utilization percentage on the row, color-coded by severity.
Row Drill-Down
Each row can be expanded via the chevron on the left. The expanded view reveals the individual daily and monthly limits in effect for that project, the configured ceilings, and the current utilization for each.
Note: Spend limits are configured by administrators or project managers on the Projects page. If a limit shown here looks wrong, contact your administrator.