Alerts
The Alerts section of the admin portal lets operators view firing spend-limit alerts and manage the rules that trigger them. It is only available when Alertmanager is enabled for the deployment (ALERTMANAGER_URL is set). When alerting is disabled, the page shows empty lists.
Role access: Super Admin, Admin, Project Manager, and Auditor can view alerts and rules. Only Super Admin and Admin can create, edit, or delete alert rules.
The section has two tabs:
- Alerts — a read-only table of currently firing (and optionally suppressed) alerts sourced from Alertmanager.
- Rules — the configurable spend-limit alert rules stored in the gateway database.
Alerts tab
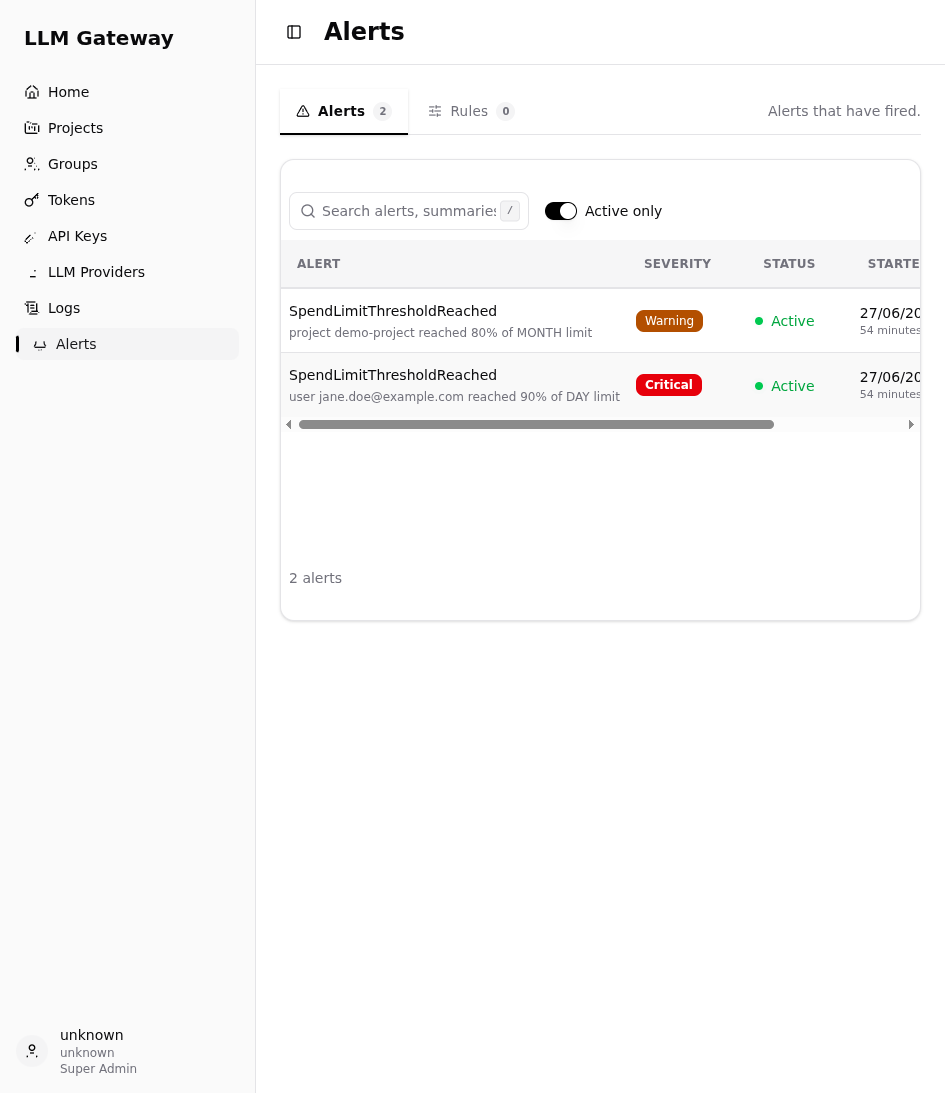
The Alerts tab lists every alert that Alertmanager has received and processed. By default it shows only active alerts. Use the Active only toggle to include suppressed alerts (silenced or inhibited by Alertmanager).
A search box lets you filter by alert name, summary text, or any label value.
Each row shows:
| Column | Description |
|---|---|
| Alert | Alert name (SpendLimitThresholdReached) and the annotation summary, e.g. project demo-project reached 80% of MONTH limit. |
| Severity | Severity badge: Info, Warning, Error, or Critical. |
| Status | Active (green dot) or Suppressed. |
| Started | Timestamp when the alert first fired, with a relative age. |
| Details | Opens the detail dialog. |
The row count is displayed below the table.
Alert detail dialog
Click View on any row to open the detail dialog.
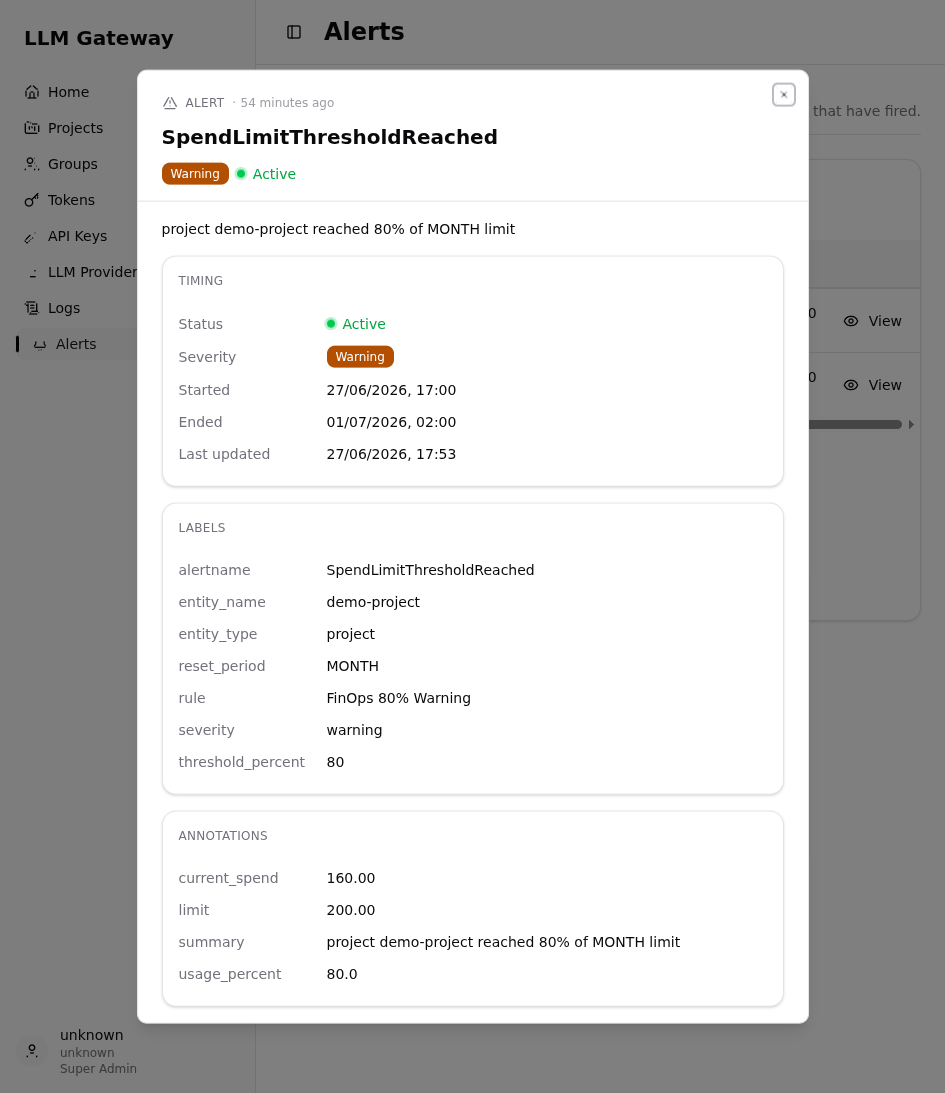
The dialog shows:
Timing section
| Field | Description |
|---|---|
| Status | Active or Suppressed |
| Severity | Configured severity badge |
| Started | When the alert started firing |
| Ended | When Alertmanager will auto-resolve the alert |
| Last updated | When Alertmanager last received a POST for this alert |
Labels section — all Alertmanager labels carried on the alert, displayed as generic key/value rows. The exact labels depend on the alert type; see the type-specific sections below for details.
Annotations section — human-readable context, also displayed as generic key/value rows. Annotations typically include a summary field with a plain-English description of the condition that fired.
Alert lifecycle
Each alert carries an endsAt timestamp set by the producer. Alertmanager auto-resolves the alert when that time passes with no refresh POST. How endsAt is determined depends on the alert type; see the type-specific sections below for details.
Rules tab
Alert rules define when an alert fires and who is notified. Every rule is evaluated in the background after each proxied request completes; evaluation does not affect request latency.
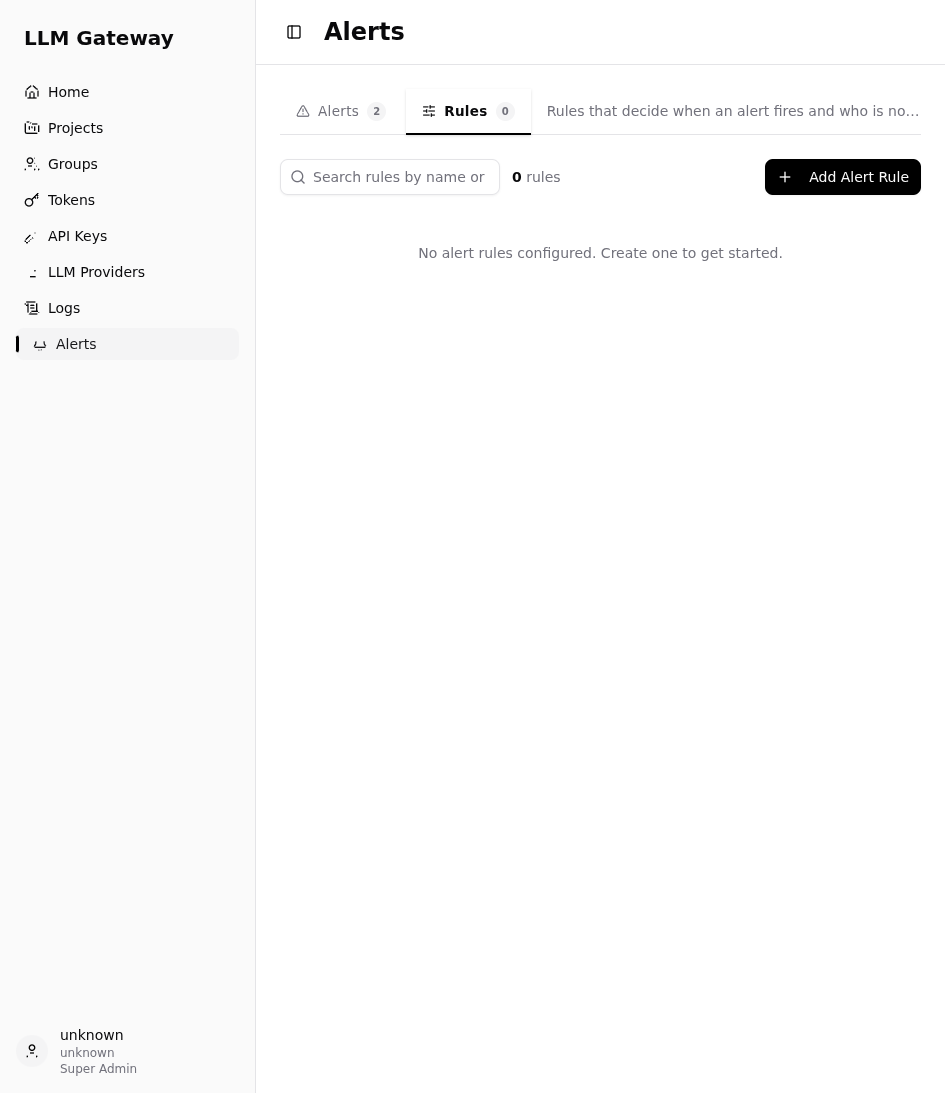
The Rules tab lists all configured alert rules. Use the search box to filter by name or description. The badge on the tab shows the total rule count.
Creating an alert rule
Click Add Alert Rule to open the creation dialog.
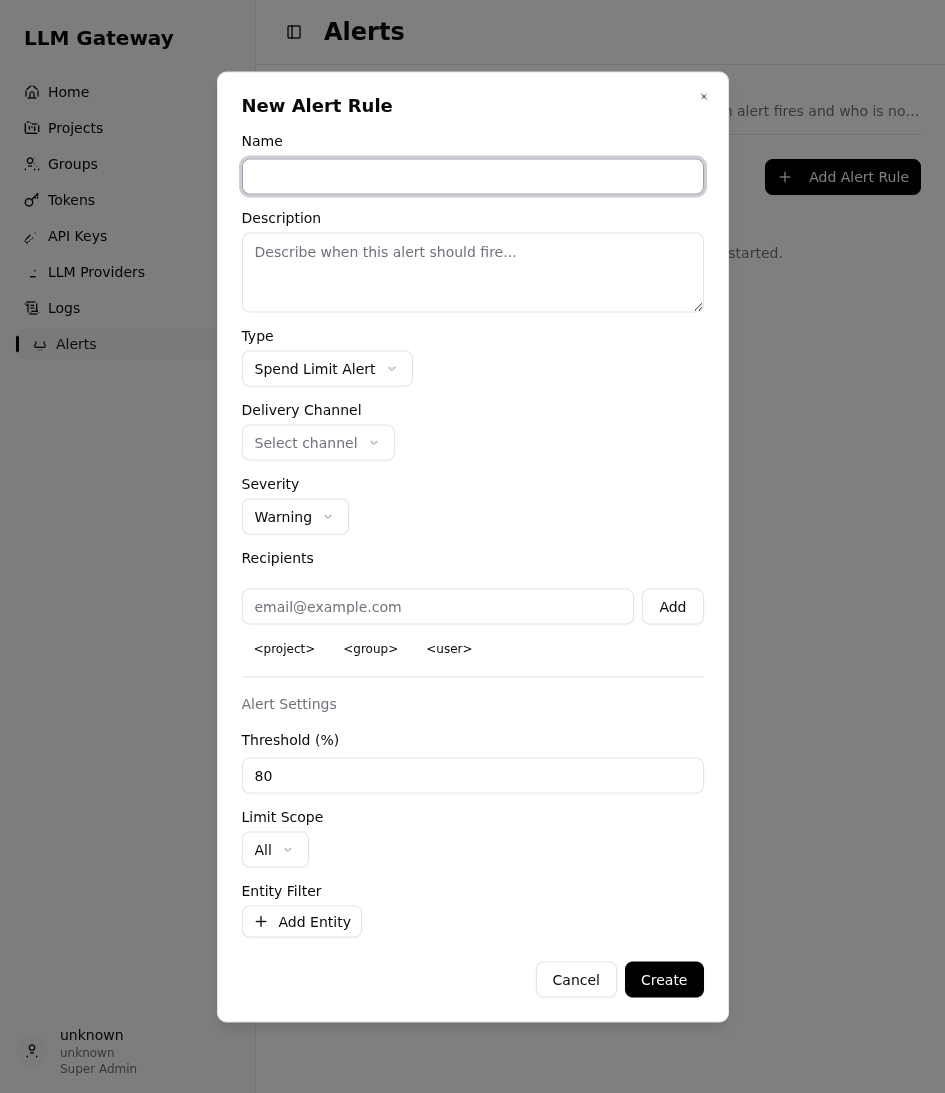
Every alert rule has the following common fields regardless of type:
| Field | Description |
|---|---|
| Name | Unique identifier for the rule. |
| Description | Optional free-text description of when the rule fires. |
| Type | The kind of condition the rule evaluates. Determines which additional fields appear below. |
| Delivery Channel | Notification channel (e.g. email). Available channels depend on the Alertmanager receiver configuration for the deployment. |
| Severity | Info, Warning, Error, or Critical. Defaults to Warning. Carried as the severity label on the posted alert and can be used to drive Alertmanager routing. |
| Recipients | One or more email addresses and/or special tokens. |
Depending on the selected Type, additional fields appear in the Alert Settings section. See the type-specific sections below for details.
Recipient tokens
In addition to literal email addresses, the Recipients field supports three special tokens that resolve to a concrete address at alert-build time, based on the entity the alert is about:
| Token | Resolves to |
|---|---|
<project> |
The project's contact_email, or its owner address as a fallback |
<group> |
The group's contact_email (no fallback; dropped if not set) |
<user> |
The user's contact_email, or the user's login name (UPN) as a fallback |
Tokens whose type does not match the alerted entity (e.g. <project> on a user alert) are silently dropped. Use the quick-add buttons in the dialog to insert a token without typing it.
A rule with recipients = ["<project>", "finops@example.com"] notifies the project contact and a fixed address for every alert it fires.
Editing and deleting rules
Expand a rule in the list to see its full detail, then use the Edit or Delete buttons. The rule type cannot be changed after creation. Deleting a rule does not resolve any alerts already in Alertmanager; those expire at their billing period boundary.
Spend Limit Alert rules
Type identifier: spend_limit_alert
A Spend Limit Alert fires when an entity's accumulated spend in the current billing period reaches a configured percentage of its hard spend limit. The evaluation runs in the background after every proxied request; it never affects request latency.
Alert identity in Alertmanager: alertname = SpendLimitThresholdReached. Alerts are grouped by (alertname, entity_type, entity_name, threshold_percent, reset_period), so one group is maintained per distinct threshold and billing period for each entity.
Configuration fields
In addition to the common rule fields, a Spend Limit Alert has the following fields in the Alert Settings section:
| Field | Description |
|---|---|
| Threshold (%) | Integer from 1 to 100. The alert fires when current_spend / hard_limit × 100 ≥ threshold. |
| Limit Scope | Restricts which entity types are considered. All matches any entity type; Project, Group, and User match only the respective type's limits. |
| Entity Filter | Optional list of (type, name) pairs. When set, the rule only evaluates the listed entities. When empty, it applies to every entity that matches the Limit Scope. |
How evaluation works
After each proxied request the gateway:
- Fetches the current set of
spend_limit_alertrules (cached for up toSPEND_ALERT_RULES_CACHE_TTL_SECONDSseconds). - For each entity involved in the request, finds the rules where Limit Scope and Entity Filter match.
- For each matching
(entity, spend limit, rule)combination, fetches the current period spend and checks whetherusage_percent ≥ threshold_percent. Limits with a zero or negative cap are skipped. - For each combination that fires, builds an Alertmanager alert and POSTs the batch.
Alert lifetime
The alert's endsAt is set to the next billing-period boundary (midnight UTC at the start of the next day, week, month, or year). Alertmanager auto-resolves the alert at that moment with no second POST from the gateway. A re-breach within the same period re-POSTs the same alert, refreshing it without creating a duplicate.
If spend is manually brought back under the limit mid-period (e.g. via a limit increase), the alert continues to fire until the period ends because it tracks "breached this period", not "currently over".
Alert labels and annotations
Labels carried on every Spend Limit Alert (queryable in Alertmanager and visible in the detail dialog):
| Label | Value |
|---|---|
alertname |
SpendLimitThresholdReached |
entity_name |
Name of the entity whose spend crossed the threshold |
entity_type |
project, groups, or user |
reset_period |
DAY, WEEK, MONTH, or YEAR |
rule |
Name of the alert rule |
severity |
Severity configured on the rule |
threshold_percent |
The rule's threshold value |
recipients |
Comma-separated resolved email addresses (omitted when the rule has no recipients) |
Annotations (human-readable context shown in the detail dialog):
| Annotation | Value |
|---|---|
summary |
Plain-English description, e.g. project 'demo-project' reached 80% of its MONTH spend limit |
current_spend |
Spend accumulated so far in the billing period |
limit |
The hard spend limit being tracked |
usage_percent |
Current spend as a percentage of the limit |
How alerting works end-to-end
- An admin configures one or more alert rules in the portal (Rules tab).
- After every proxied request, the gateway evaluates the configured rules against the entities involved (background task, off the critical path).
- For each condition that fires, the gateway builds an
AlertmanagerAlertand POSTs it to Alertmanager. - Alertmanager groups, deduplicates, and routes alerts according to its declarative configuration (
alertmanager.yml), then delivers notifications to the configured receiver. - The admin portal Alerts tab reads the live state from Alertmanager and presents it through an engine-agnostic provider abstraction, so the view does not change if the alerting backend is swapped.
Delivery is best-effort. A failed POST to Alertmanager is logged but never retried and never affects the proxied request. If Alertmanager is unreachable, alerts are silently dropped until it recovers.