Home
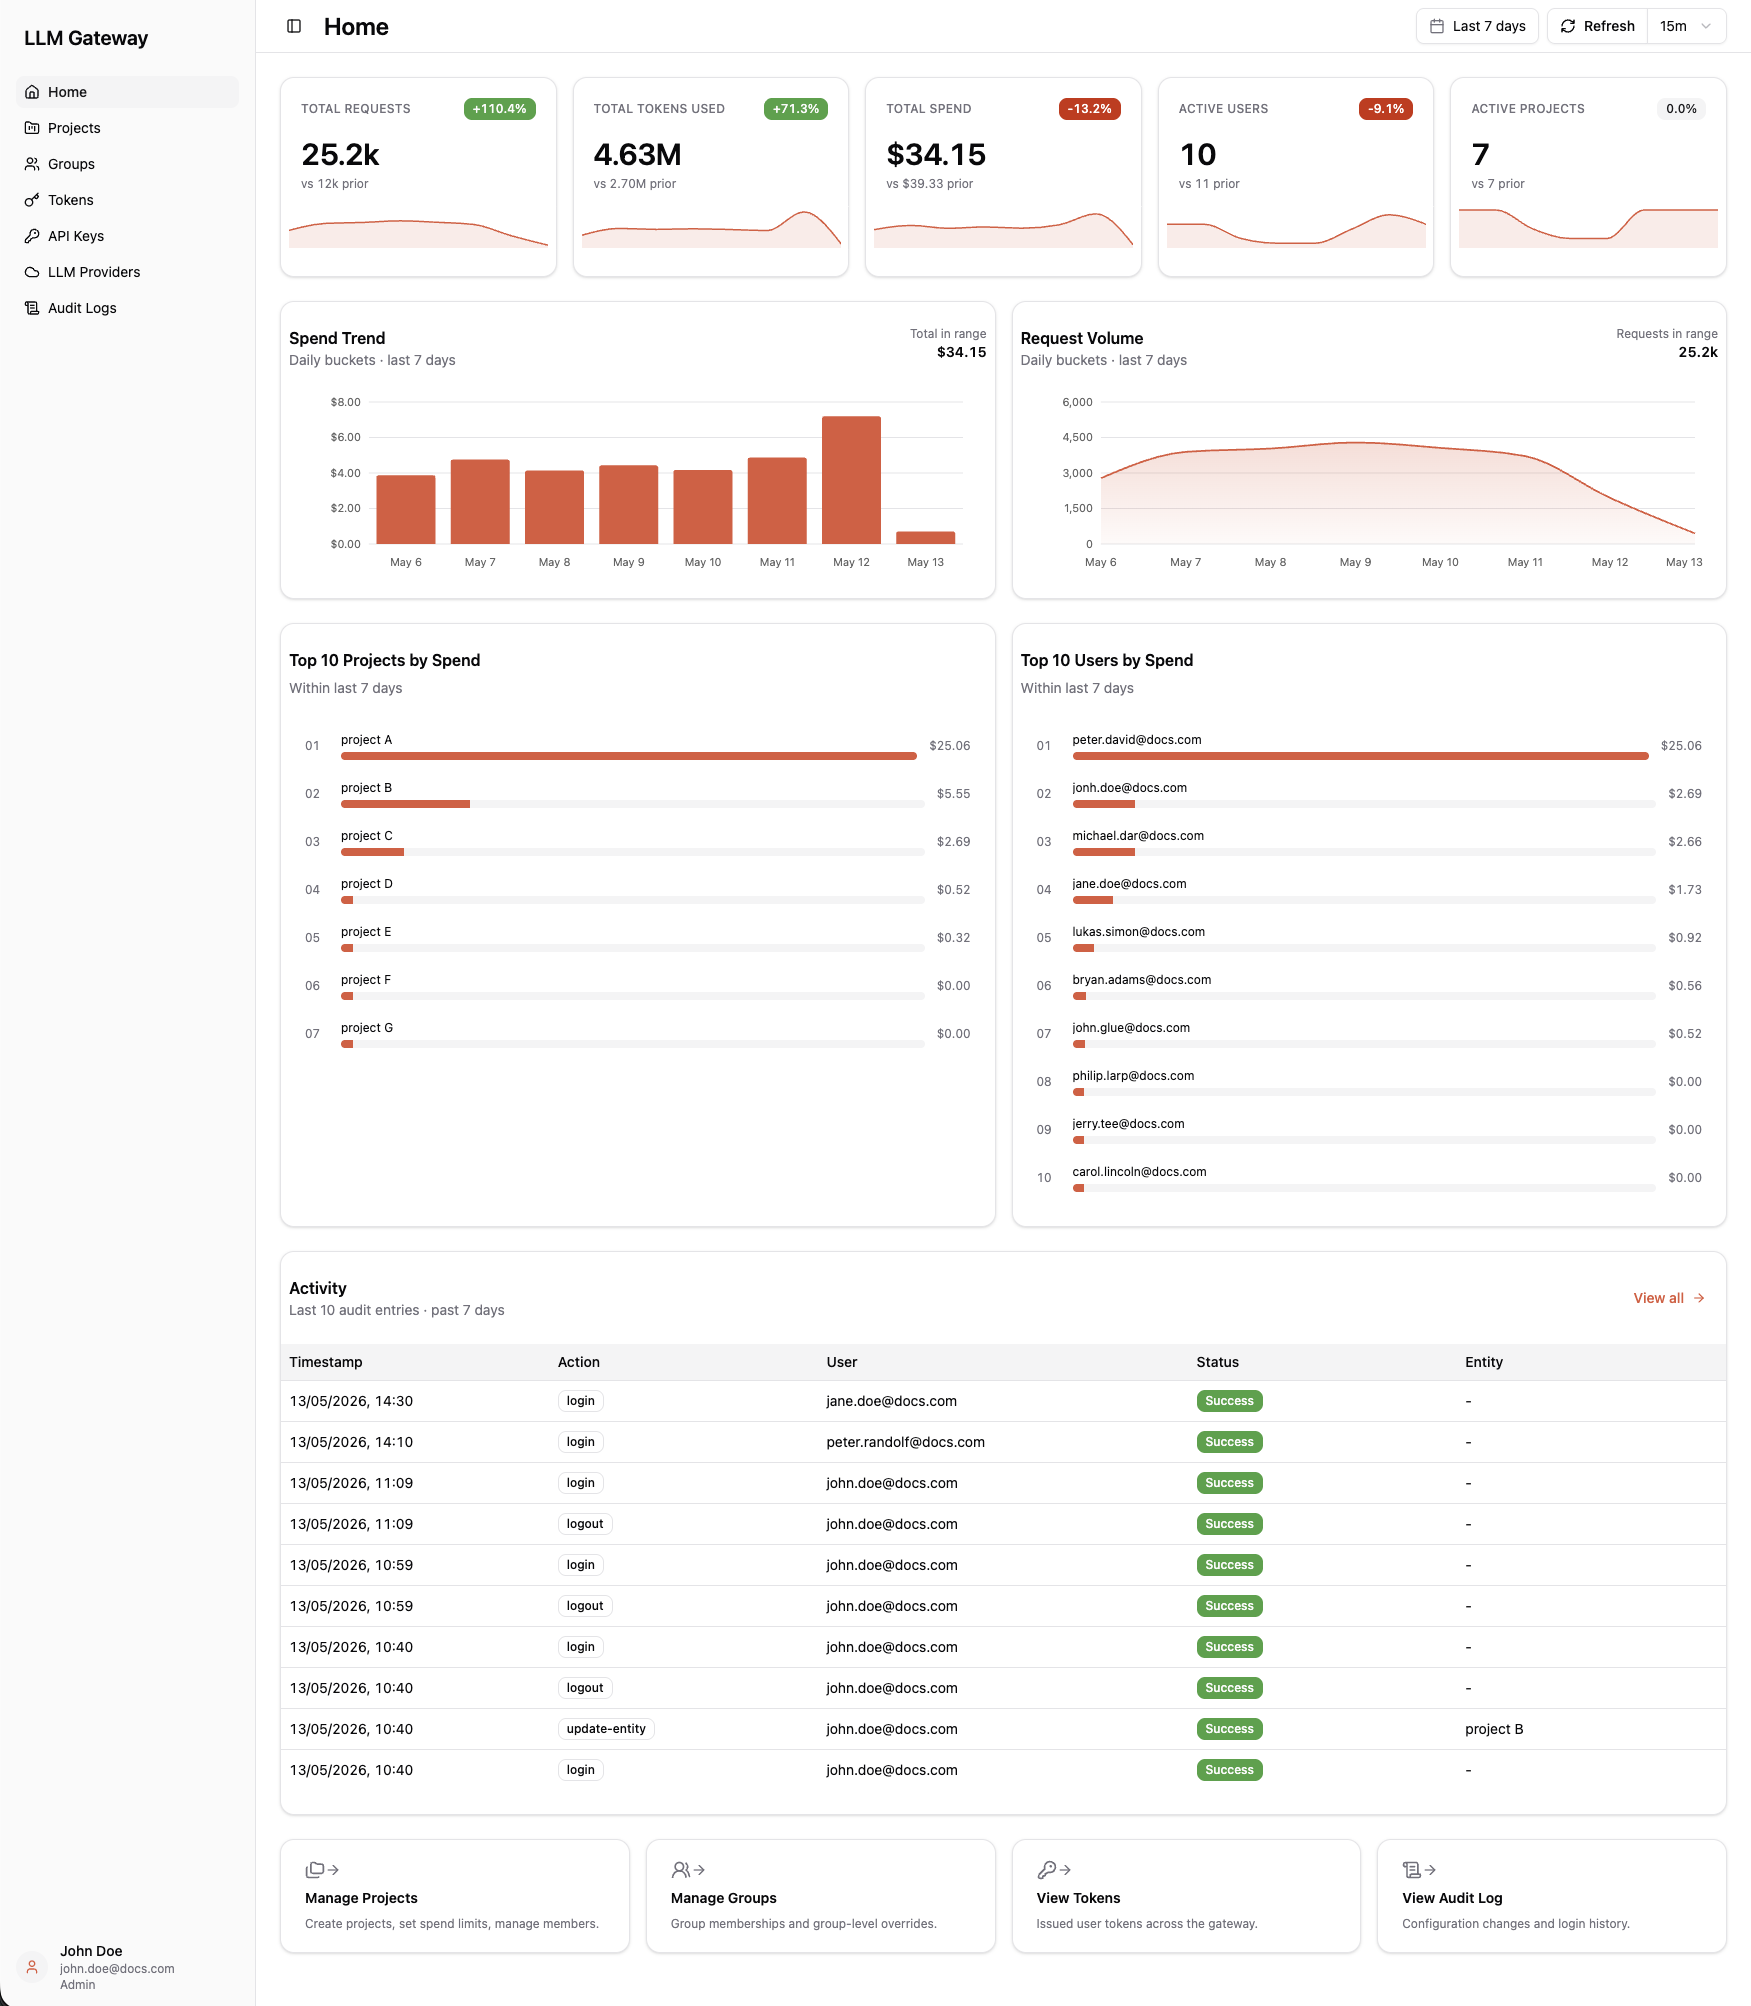
The Home page is the landing dashboard for management-view users. It summarizes spend, request traffic, and recent activity across all projects in your LLM Gateway deployment for a chosen time range.
Role access: Super Admin, Admin, Project Manager, and Auditor can view the Home dashboard. User does not have access to this page.
On This Page
- Time Range Picker - Drive every widget on the page
- Key Metrics - Headline spend and request totals
- Spend Trend - Daily spend over the selected range
- Request Volume - Daily request count over the selected range
- Top Projects and Top Users - Ranked breakdowns by spend or requests
- Activity Feed - Recent audit log entries
- Quick Links - Shortcuts to other admin areas
Time Range Picker
The time range picker sits at the top of the page and drives every widget below it. You can pick a named range (Last 24 hours, Last 7 days, Last 30 days, or Last 90 days) or define a custom start and end date. Custom ranges are capped at 365 days by default; operators can adjust the cap via the USAGE_MAX_CUSTOM_WINDOW_DAYS environment variable on the backend.
Changing the range refreshes the KPI tiles, both charts, the Top Projects and Top Users rankings, and the activity feed.
Key Metrics
The KPI row shows headline numbers for the selected time range: total requests, total tokens used, total spend, active users, and active projects. Each tile also displays the previous period's value, the percentage change, and a sparkline for the metric.
Spend Trend
The spend trend chart plots aggregated spend over the selected time range. Use it to spot day-over-day cost spikes or sustained ramps. The card header also shows the total spend in the selected range.
Request Volume
The request volume chart plots the number of requests routed through the gateway over the selected time range. It complements the spend chart by showing traffic patterns independent of cost.
Top Projects and Top Users
Two ranked lists highlight the projects and users with the highest activity in the selected time range. Each chart ranks the top N entries so you can quickly see where spend or traffic is concentrated.
Activity Feed
The activity feed surfaces recent audit log entries (creations, deletions, configuration changes) so you can see what is changing in the portal at a glance. For the full filterable audit history, see the Audit Logs page.
Quick Links
The quick links panel provides shortcuts to commonly used admin areas (Projects, Groups, Tokens, Audit Logs). Click any tile to jump straight to that page.