Grafana Monitoring for LLMGW
For our primary monitoring and observability for the LLMGW system we use Grafana. It provides real-time dashboards and visualizations that help us:
- Monitor system performance and health
- Track API usage and response times
- Analyze user behavior and traffic patterns
- Identify and troubleshoot issues quickly
- View historical trends and metrics
Accessing Grafana
We use Azure Active Directory (Azure AD) for authentication. To log in:
- Navigate to the login URL: https://<grafana-deployment-url>/
- Click the “Sign in with Azure AD” button (shown at the bottom of the login form)
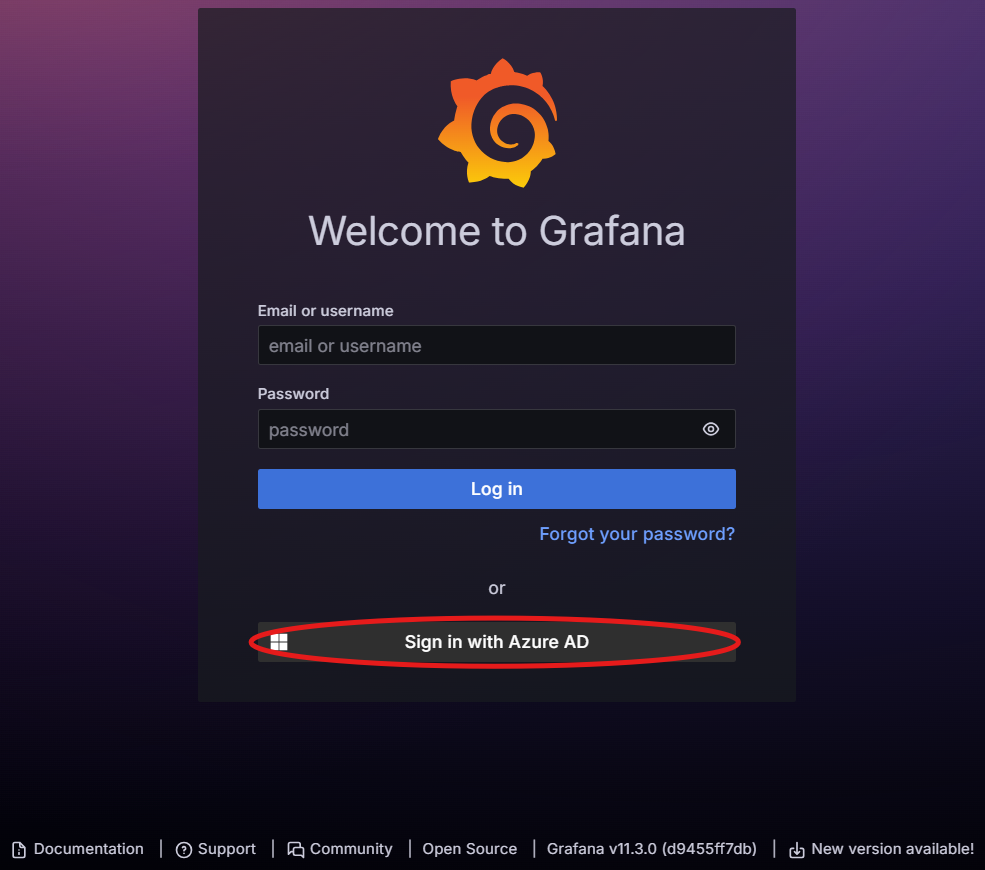
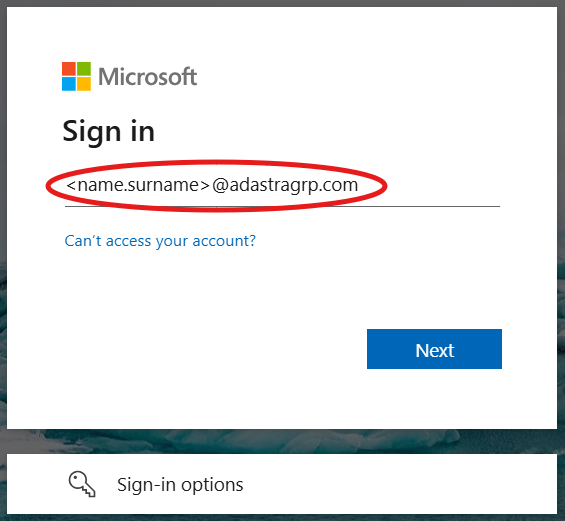
- You’ll be redirected to Microsoft’s authentication page
- Use your company Azure AD credentials
Note: You need to be granted access to the Grafana instance. If you don’t have access, contact your system administrator.
What’s available
Once logged in, you’ll have access to several dashboards that monitor different aspects of the LLMGW system:
-
Flow ID Dashboard - Track request flows and processing pipelines,
-
DevOps Dashboard - System health, infrastructure metrics, and deployment status,
-
Model Analytics Dashboard - ML model performance, usage statistics, and analysis,
-
Projects Dashboard - Project-specific metrics, resource usage, and performance tracking,
-
Users & Groups Dashboard - User activity, authentication metrics, and group-based analytics.
Each dashboard provides specific insights and metrics relevant to its domain. Click on the links above for detailed guides on interpreting each dashboard’s data.
Getting Help
- For Grafana access issues, contact your system administrator
- For dashboard-specific questions, refer to the individual dashboard guides
- For technical issues with the monitoring data, check with the DevOps team