LLM Gateway PROJECTS
The Projects dashboard provides insights into project-specific usage, costs, and performance across your LLM Gateway deployment. This dashboard helps track resource consumption and spending at the project level. For example Agate is 1 project.
Dashboard Components
Overview metrics
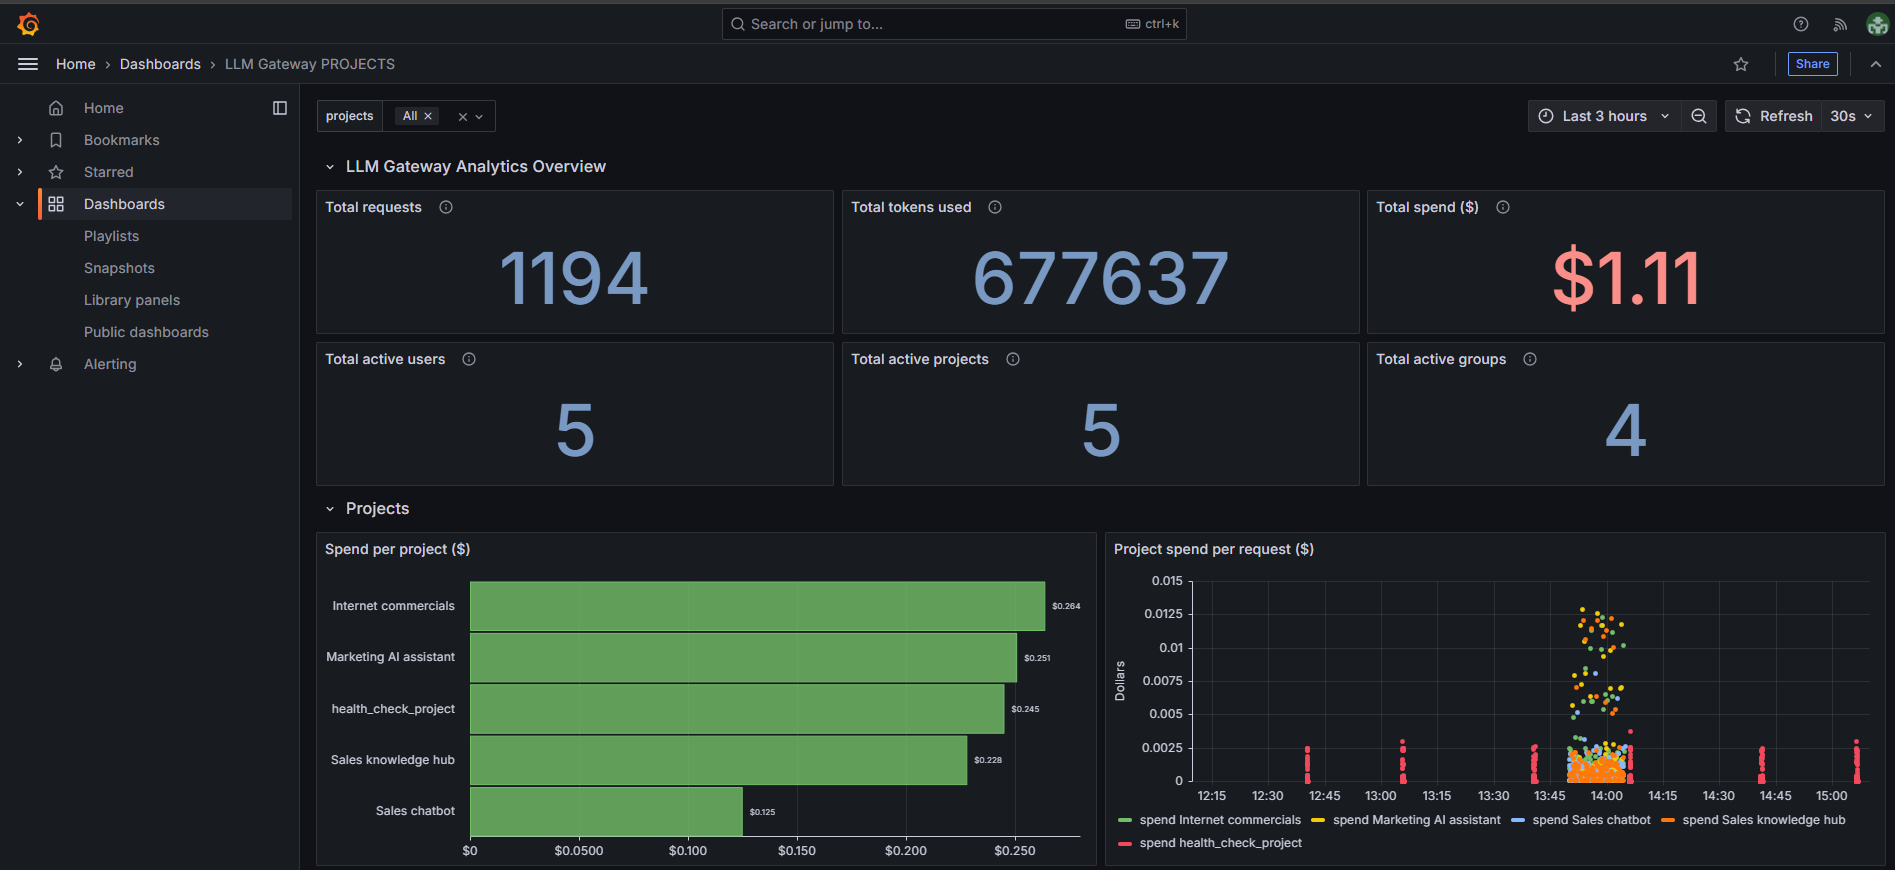
The dashboard displays six key metrics tiles providing a high-level summary:
-
Total requests - Shows the total number of API requests made,
-
Total tokens used - Displays the aggregate token consumption,
-
Total spend ($) - Shows the cumulative cost for all project usage,
-
Total active users - Number of unique users active across projects,
-
Total active projects - Count of projects with recent activity,
-
Total active groups - Number of active project groups.
Projects section
-
Spend per project ($) - Bar chart showing cost breakdown by individual projects,
-
Remaining spend per project ($) - Shows budget remaining or spending limits for each project,
-
Project spend per request ($) - Scatter plot showing spend per request over time for different projects, helping identify cost patterns per request (lower is better),
-
Running cumulative total spend per project ($) - Shows cumulative spending trends over time for each project,
-
Running total spend per project ($) - Bar chart displaying total accumulated spending by project.
-
Tokens per project - Displays token consumption patterns over time for different projects, showing usage trends and spikes.
Filtering Options
The dashboard includes project-based filtering capabilities that enable targeted analysis of specific projects or groups of projects.
Projects Filter
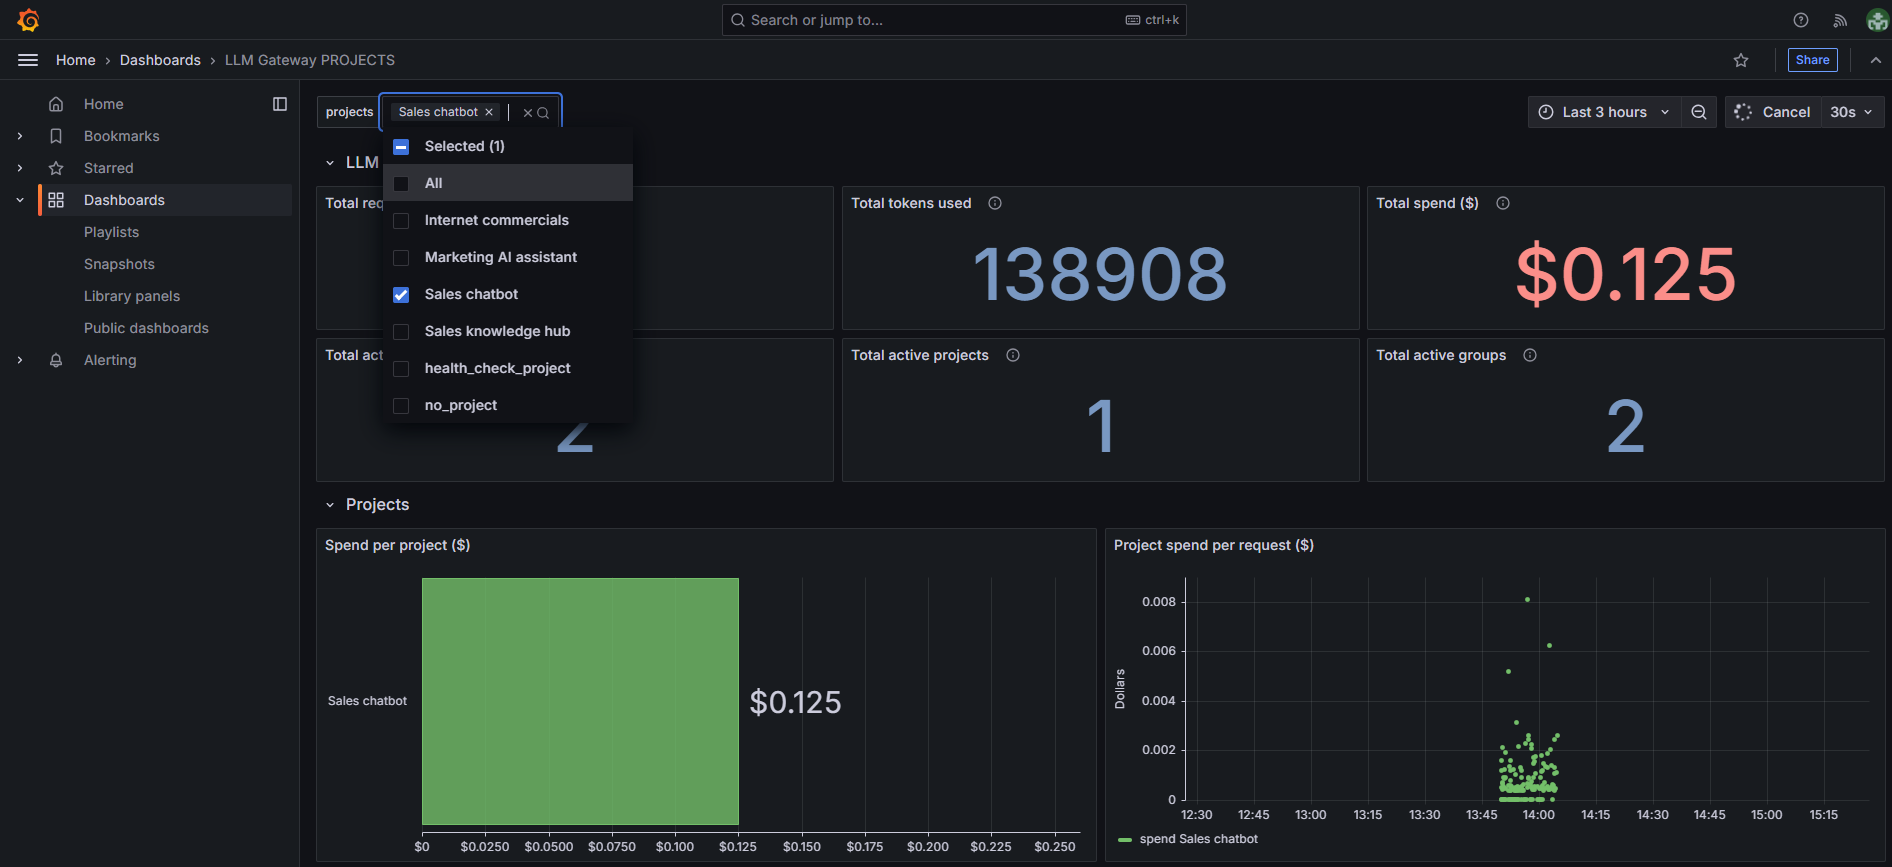
- Select specific individual projects to focus analysis on,
- Filters all dashboard metrics to display data exclusively for selected projects,
- Enables detailed cost and performance analysis of particular projects.