Dashboards
Grafana Interface Overview
Once you are logged in, you will see the Grafana home page. To access the monitoring dashboards Click on “Dashboards” in the left sidebar (highlighted in red in the screenshot below).
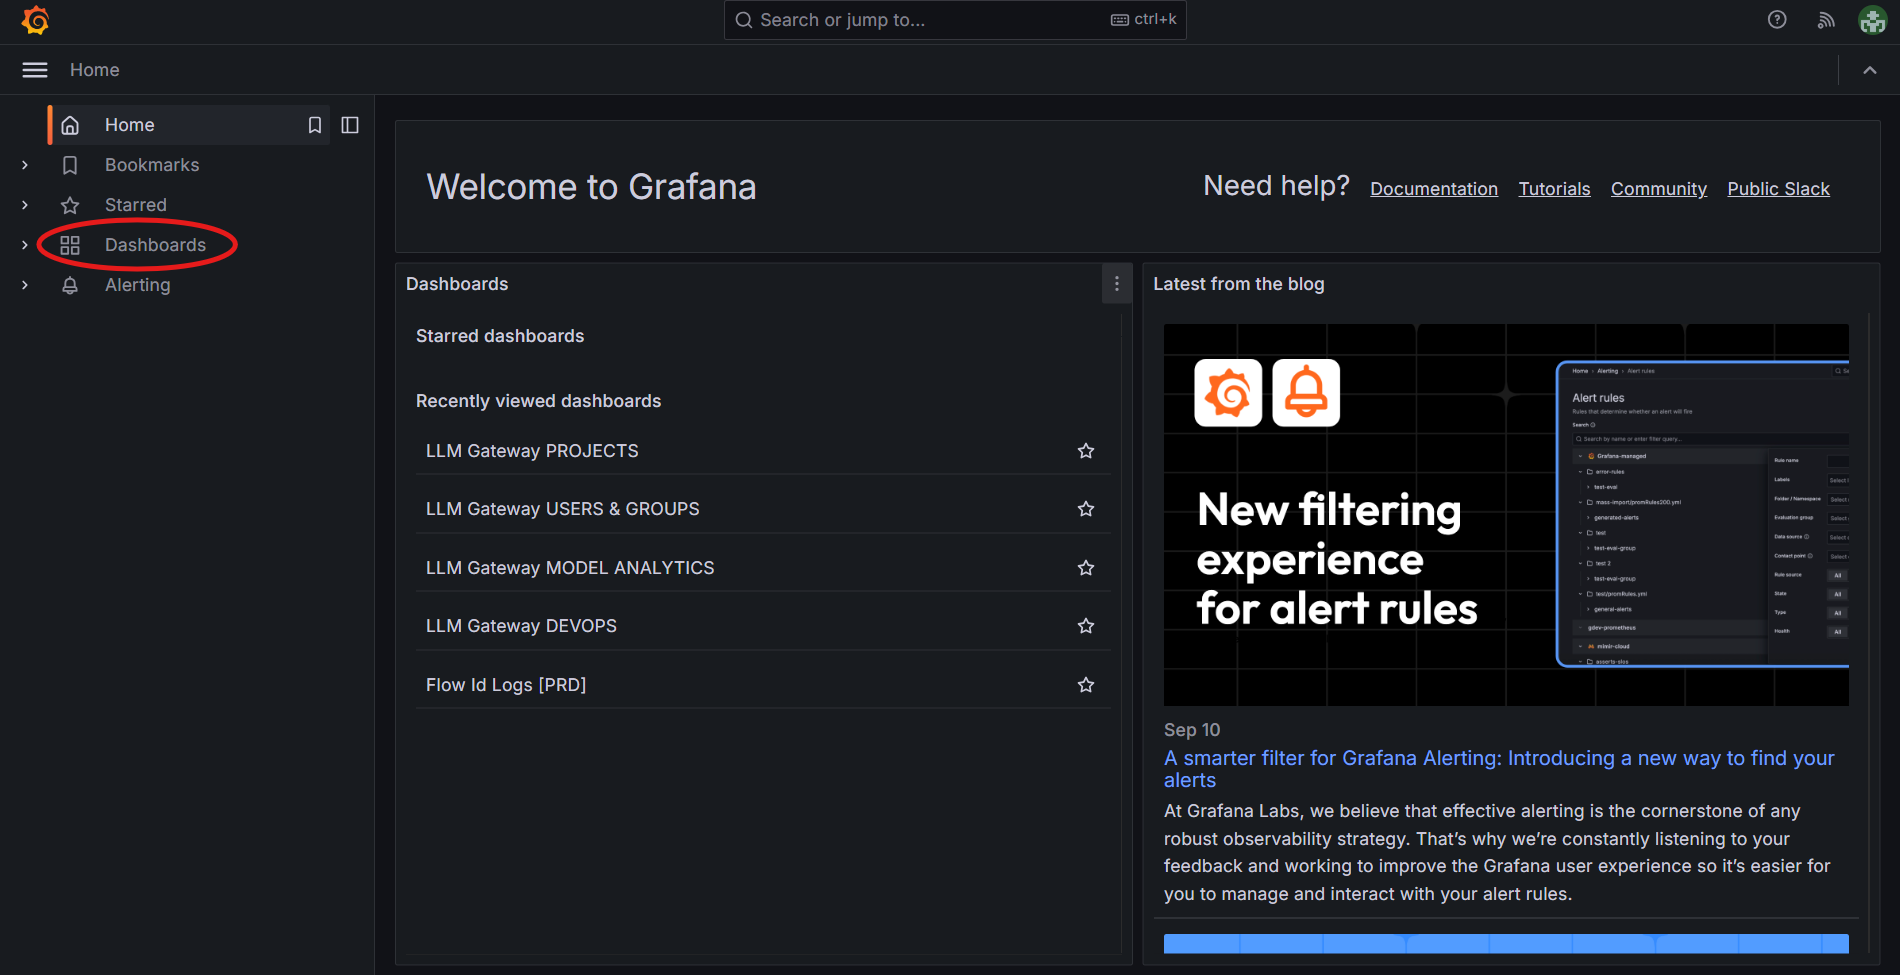
You’ll then see a list of available dashboards:
-
Flow Id Logs [PRD] - Request flow tracking and processing pipelines,
-
LLM Gateway DEVOPS - System health and infrastructure metrics,
-
LLM Gateway MODEL ANALYTICS - ML model performance and statistics,
-
LLM Gateway PROJECTS - Project-specific metrics and resource usage,
-
LLM Gateway USERS & GROUPS - User activity and group analytics.
Click on any dashboard name to open it and start monitoring.
Note: Inside the dashboard, you can star frequently used dashboards (★ icon) to add them to your “Starred dashboards” section for quick access.
Key Interface Elements
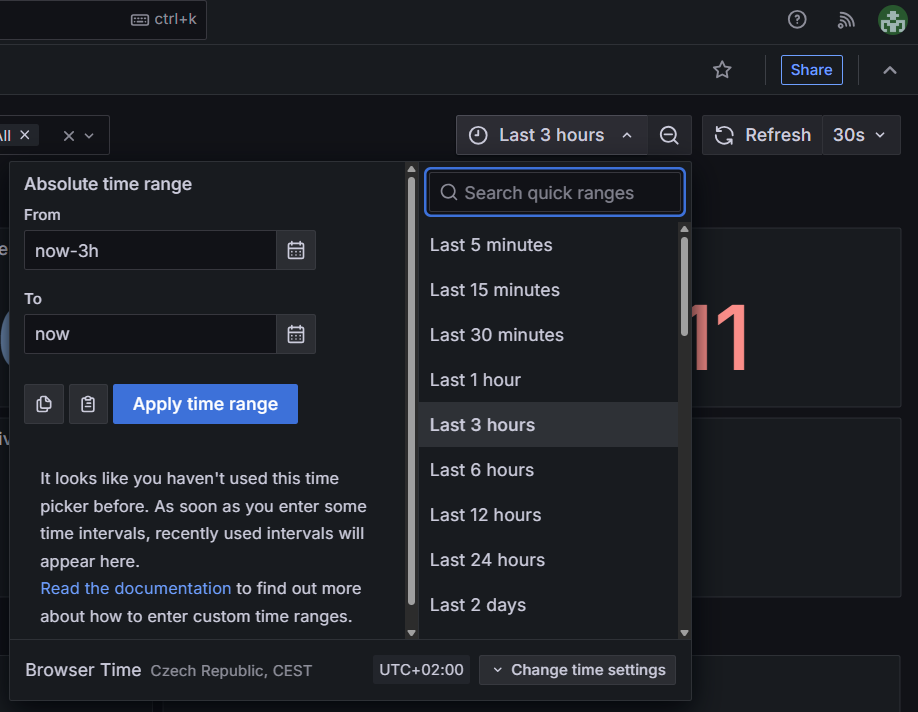
1. Time Range Selector
Click on time period (in the image above “Last 3 hours”) to change what time period you’re viewing. You have these options:
- Choose from quick presets like “Last 5 minutes”, “Last 1 hour”, “Last 24 hours”,
- Set custom absolute time ranges using “From” and “To” fields:,
- Use the calendar icons to pick specific dates,
- Write your own desired time range,
- You can also use “Zoom out” button which makes interval wider than it is set now to both the past and the future,
- In the bottom part of time control, you can change your time zone or set month of the start of fiskal year.
2. Refresh Controls
Auto-refresh settings to keep data current
- Refresh button - Manually refresh all dashboard data,
- Auto-refresh interval - Set automatic refresh (30s, 1m, 5m, etc.).
3. Dashboard Actions
- Star icon - Bookmark this dashboard as a favorite to show it in “Starred dashboards”,
- Share button - Share dashboard links (remember to lock time selection) or export data into json file.
4. Search and Filters
Use the search bar at the top of the page to quickly find specific time ranges or apply filters to your data.