LLM Gateway DEVOPS
The DevOps dashboard provides comprehensive monitoring of LLMGW system health, infrastructure metrics, and operational insights. This dashboard is essential for tracking system performance, identifying bottlenecks, and troubleshooting issues.
Dashboard Components
-
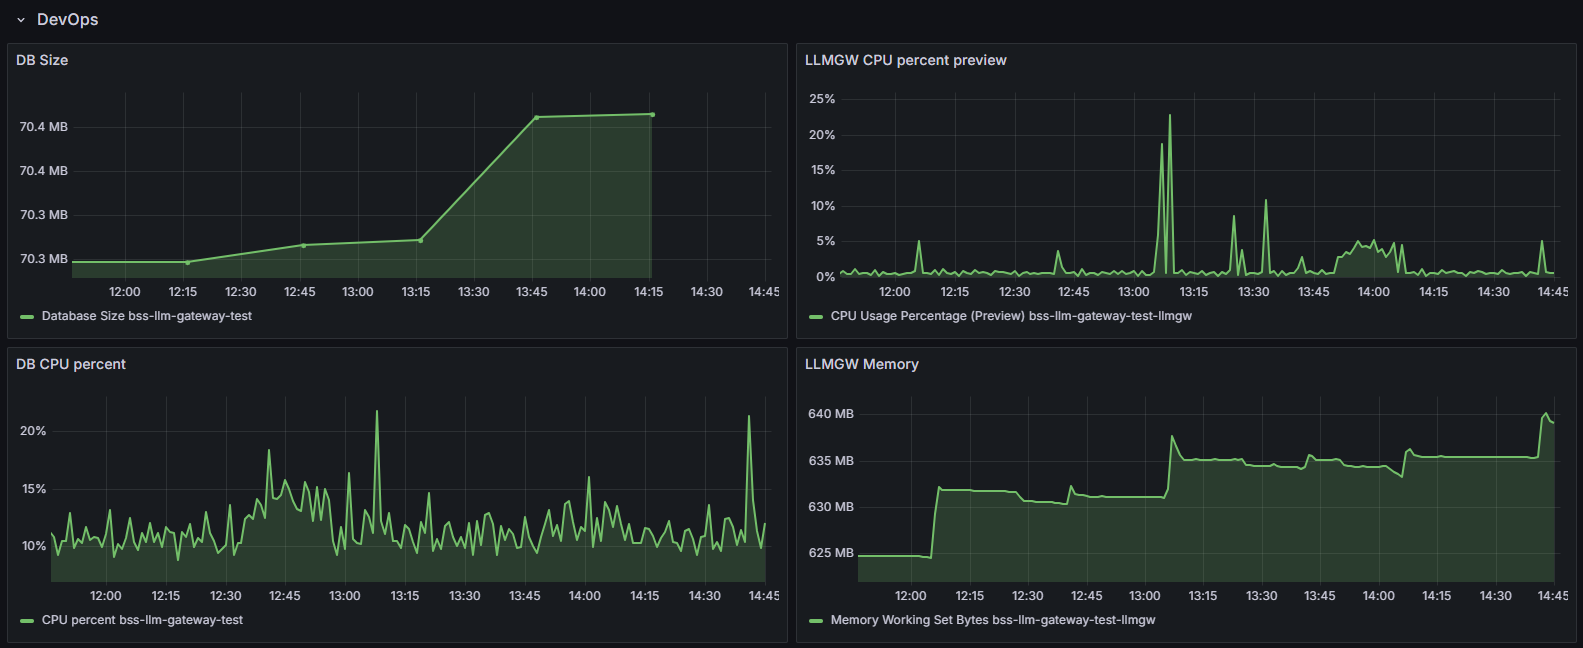
DB Size graph - Shows how much space the database occupies,
-
DB CPU percent graph - Shows database CPU usage patterns,
-
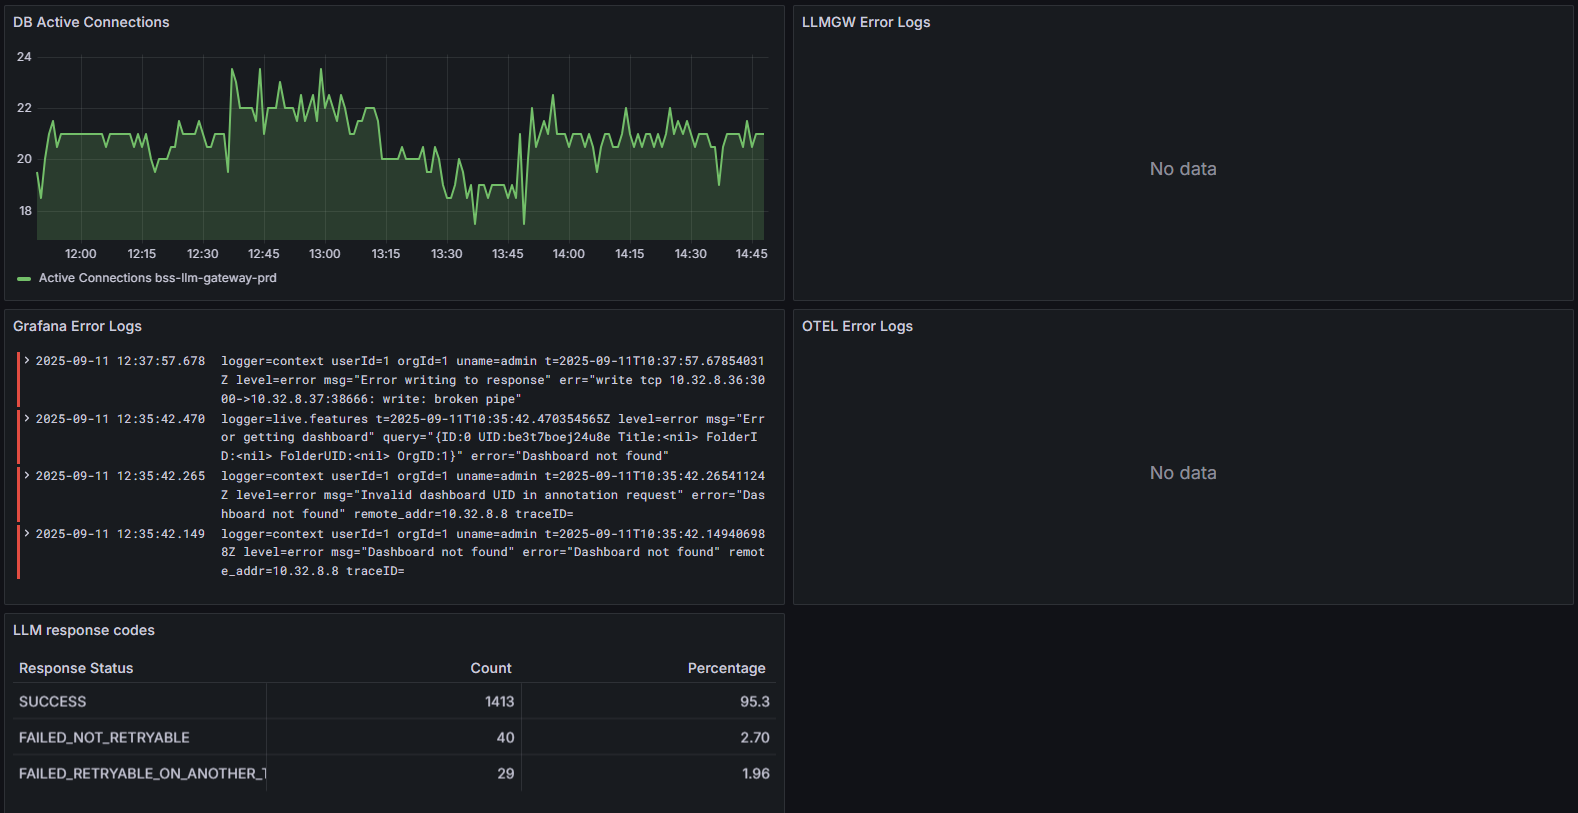
DB Active Connections graph - Shows how many active database connections are open at any time,
-
Grafana Error Logs panel - Shows errors from Grafana itself,
-
LLM response codes table - Shows the success/failure rates of LLM requests and why they fail.
-
LLMGW CPU percent preview graph - Shows CPU usage of the LLM Gateway service,
-
LLMGW Memory graph - Shows memory consumption of the LLM Gateway,
-
LLMGW Error Logs panel - Displays any errors from the LLM Gateway service,
-
OTEL Error Logs panel - Shows OpenTelemetry tracing errors.